Which streets are worst, and who gets to see what?
Tucson publishes a condition score for every street it maintains. I built the system a city IT team would run on it: a script that pulls the data on a nightly schedule, a SQL Server database that checks it, and a Power BI report where each council office sees only its own ward.
The city is spending $590 million fixing streets, worst first.
Tucson voters approved Proposition 411, a 10-year half-cent sales tax, and $590 million of it goes to neighborhood streets. The commission overseeing it picks projects first by the lowest condition score, then balances across wards and equity, so the scores steer where the money goes. Three groups lean on that same data every week.
Ward council offices
Residents call about their street. Staff need to know how their ward compares and which of their streets are next in line.
Pavement program staff
They build the worst-first list, and need to skip streets that were just repaved and catch scores that are out of date.
Utility crews and the permit desk
A newly paved major street can't be cut for five years without extra restoration work. Crews need to know before they dig.
Five steps, built to run every night with nobody touching it.
1. PullPowerShellREST API
Asks the city's ArcGIS service for street condition and moratorium data, 1,000 rows at a time. Retries if the service hiccups. At night it asks only for what changed.
2. StageSQL Server
Drops the raw rows into a holding table exactly as they arrived, so a bad download never touches the real data.
3. Clean and mergeT-SQL
Fixes known problems (county districts in the ward field, 1900 used as "unknown"), then adds new streets, updates changed ones and records every score change.
4. CheckData quality
Ten checks after every load. A partial download or an impossible score fails the run; stale or missing data is flagged for the GIS team.
5. ReportPower BIArcGIS
A ward scorecard, the worst-first list and a data health page, limited by ward. A map colored by condition.
The report and the map
What a council office or engineer actually opens.
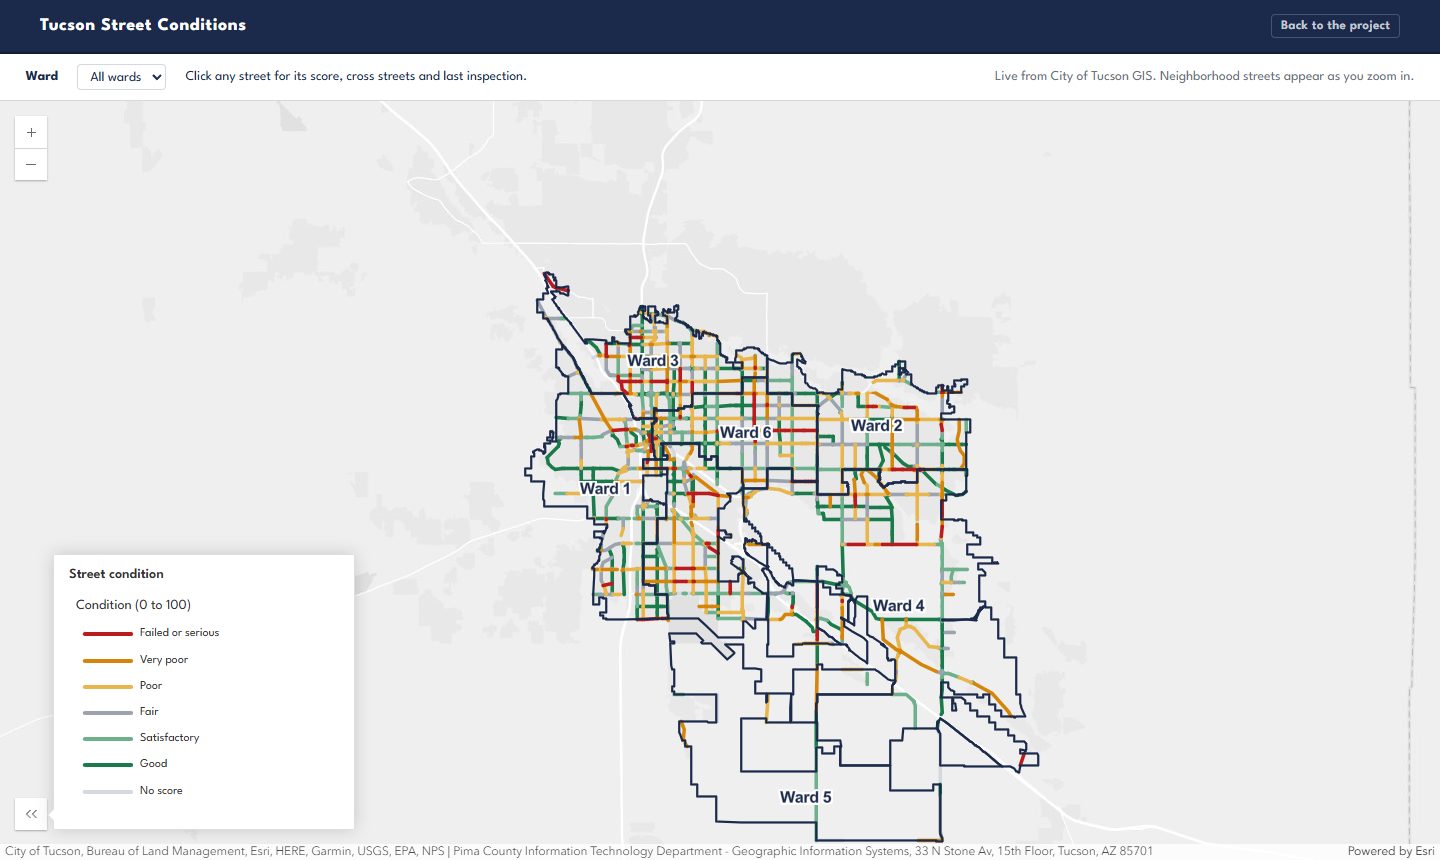
The Power BI report reads the database's reporting views. The map reads the city's own ArcGIS layers live, styled with the same condition bands.
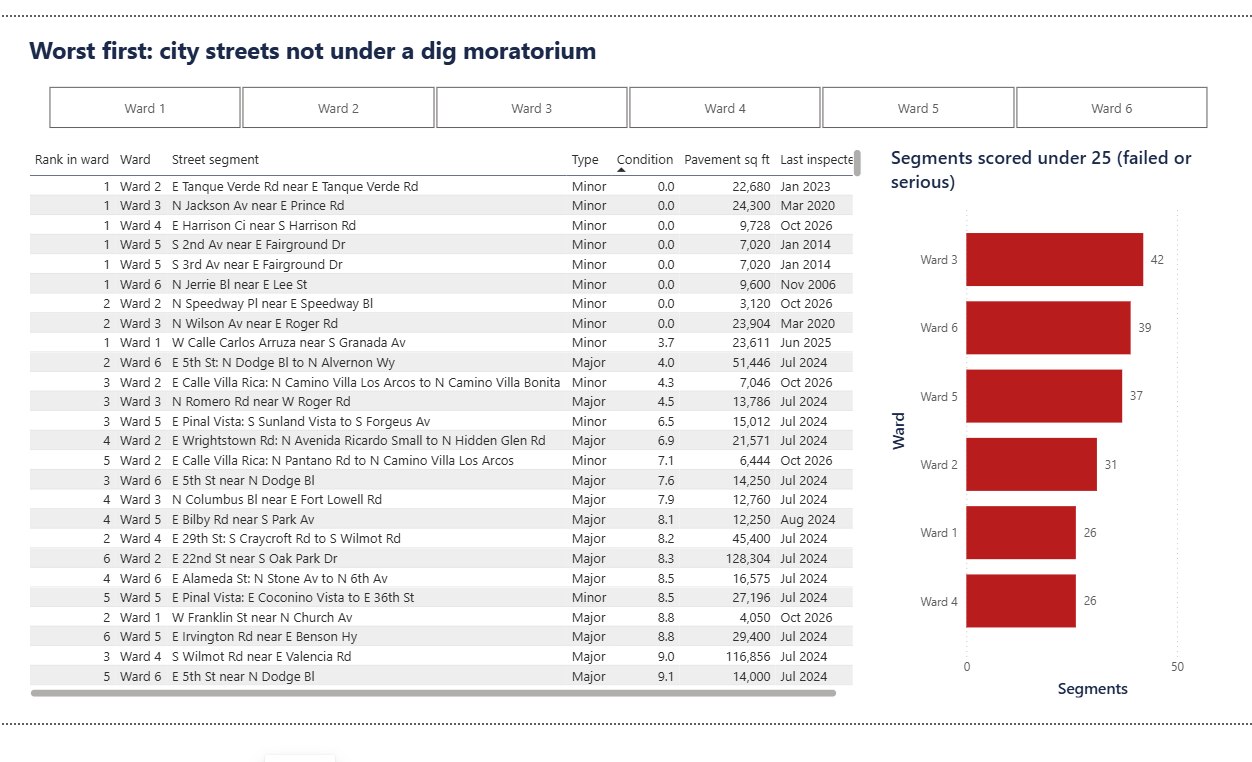
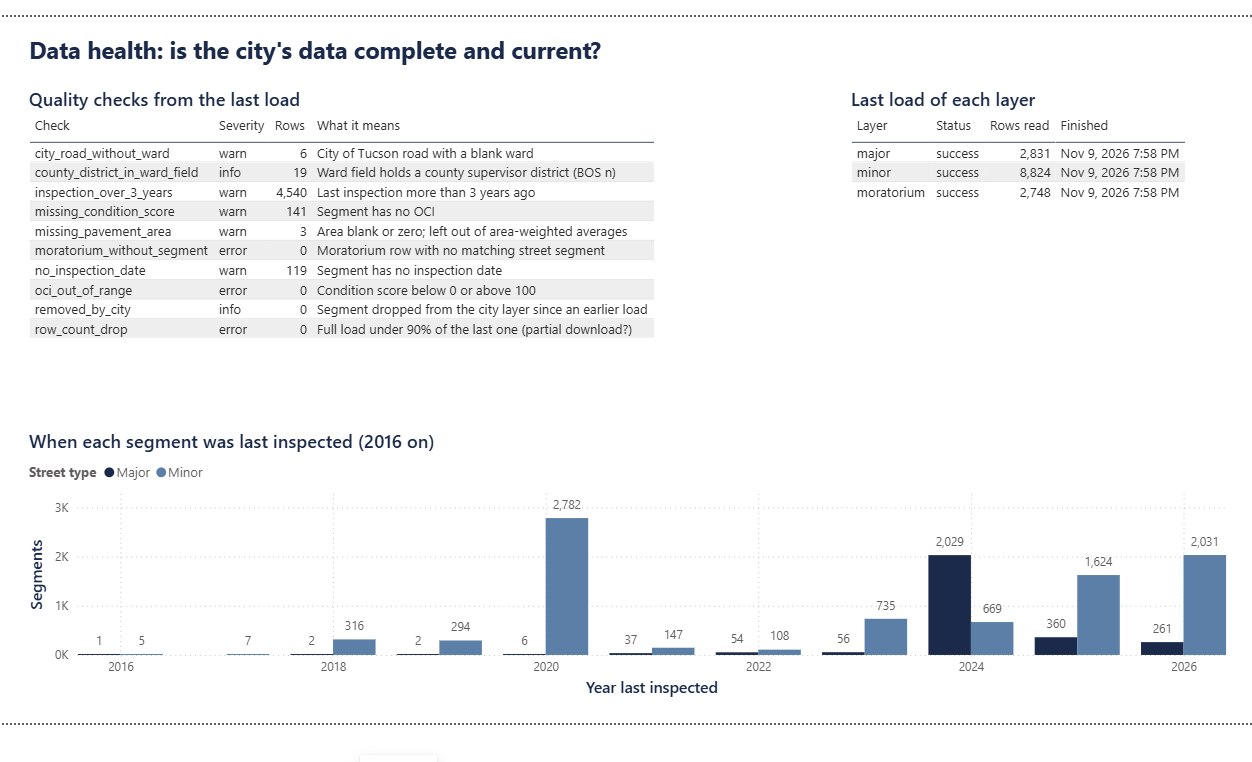
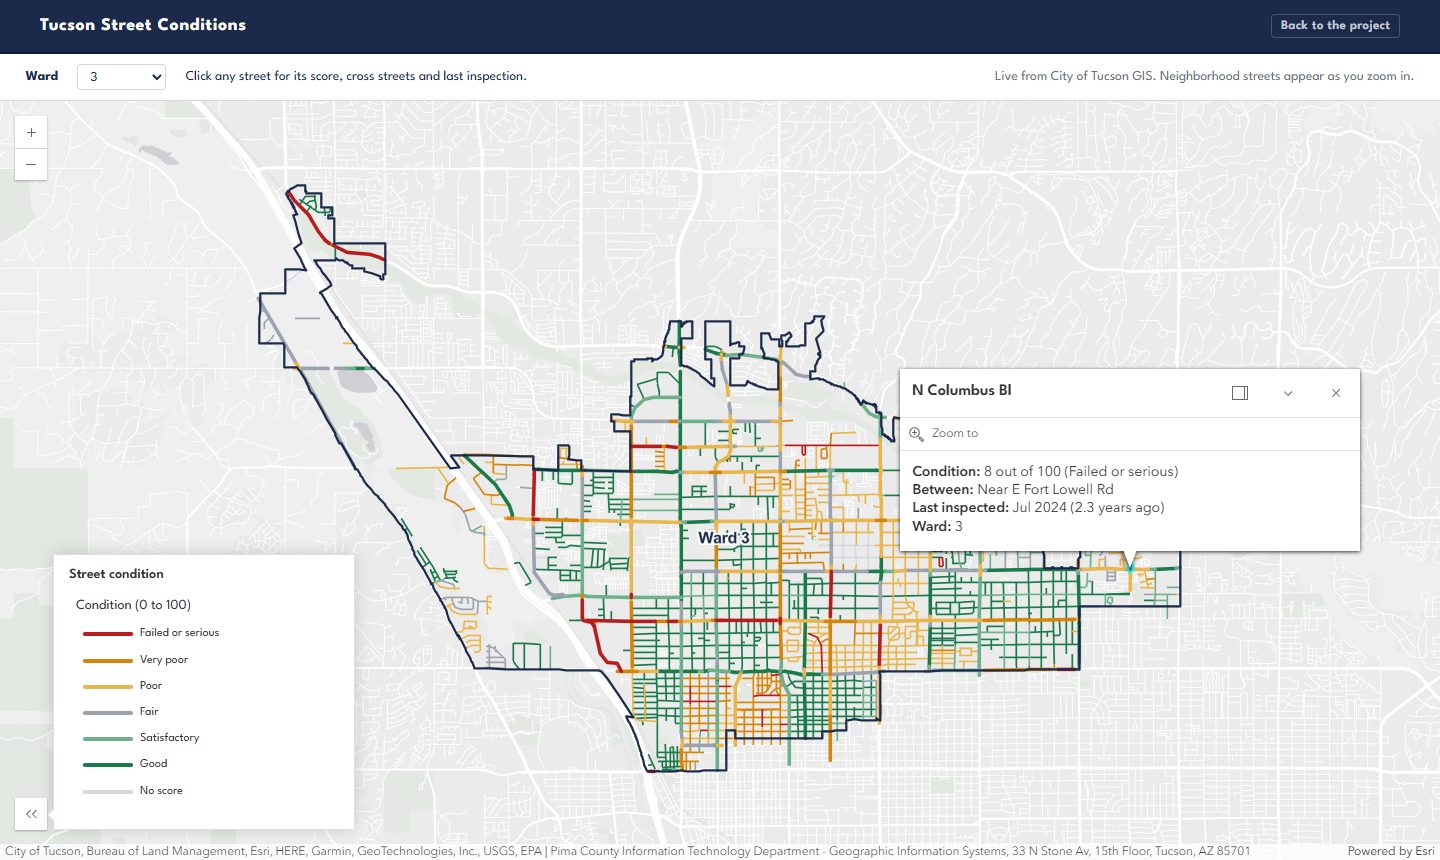
Ward scorecard. Headline numbers, each ward's average condition weighted by pavement area, and how much of each ward's pavement sits in each condition band.Worst first. The lowest-scoring city streets, skipping ones just repaved, ranked within each ward.Data health. Every quality check from the last load, whether each layer loaded, and when streets were last inspected.The street map. Every major street colored by condition, with ward boundaries. Open it.One ward, one street. Pick a ward to zoom in; click a street for its score, cross streets and last inspection.
What the data says, November 2026
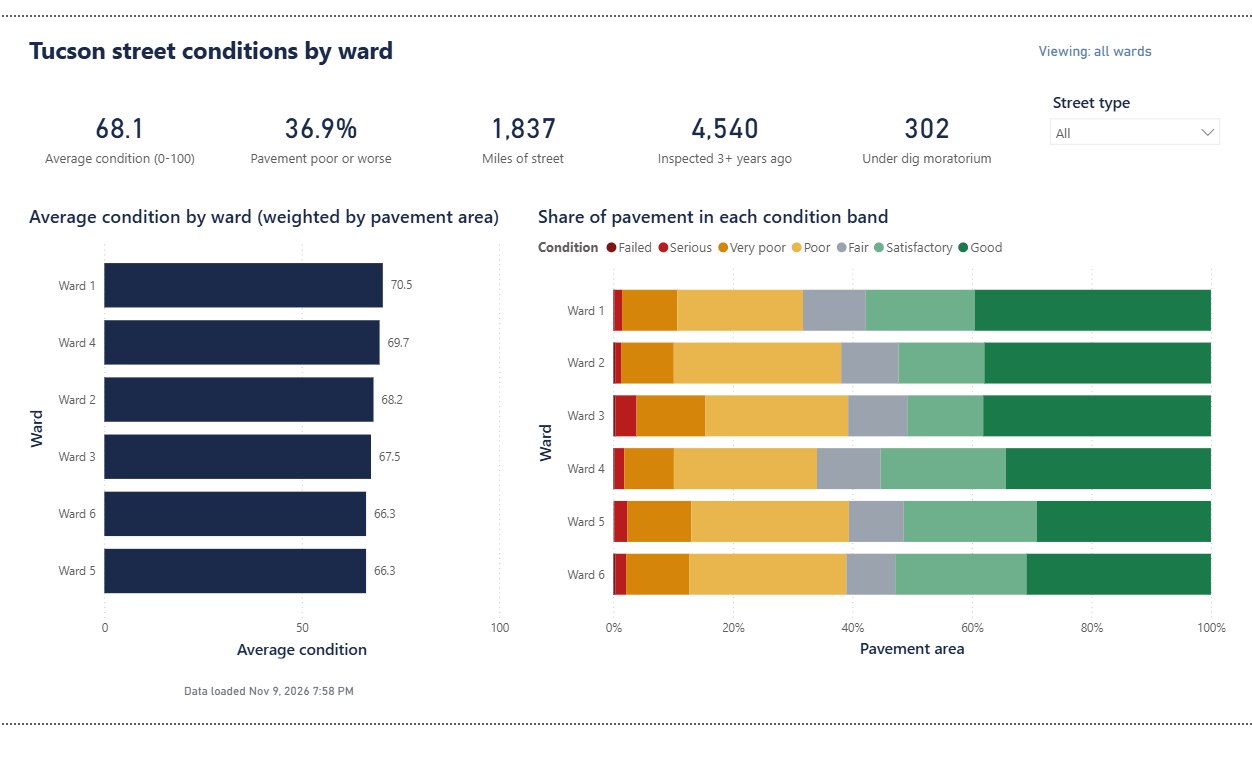
Every ward has a third or more of its pavement in poor shape or worse.
Share of each ward's pavement area in each condition band. The number on the right is the ward's average score out of 100, weighted by pavement area so a long main road counts more than a short side street.
Ward 1
70.5avg
Ward 2
68.2avg
Ward 3
67.5avg
Ward 4
69.7avg
Ward 5
66.3avg
Ward 6
66.3avg
Failed or serious (under 25)Very poor (25 to 40)Poor (40 to 55)Fair (55 to 70)Satisfactory (70 to 85)Good (85 and up)
Bands follow the ASTM D6433 pavement rating scale. Ward 3 has the most pavement in the two worst bands (15.4%).
2,782
Neighborhood streets not scored since 2020
Most neighborhood scores come from one 2020 survey. A worst-first list built on six-year-old scores can rank the wrong streets.
Re-inspect these before ranking them.
25
Streets with a broken ward
19 have a county supervisor district typed in the ward field, and 6 city streets have no ward at all. They drop out of every ward's report.
Fix at the source; the list is in the database.
0 of 67
Repaired streets still marked poor
Every street repaired after its last inspection already shows a fresh score. The city's repair records and scores line up.
No action; the check stays on.
302 major segments under a dig moratorium
Recently rebuilt or resurfaced; the last one ends September 2031. The dig-check view lists them with days left.
141 segments with no score
Left out of every average rather than counted as zero, and listed on the data health page.
Major streets are worse than neighborhood streets
Average 64.1 for major streets against 70.5 for neighborhood streets, by pavement area.
Who sees what
Each council office sees its own ward. Engineers see the whole city.
The rule is enforced in two places. The database itself filters rows by who is asking, so it holds no matter what tool someone connects with. The Power BI report has matching roles, including one that reads each person's wards from a table, so adding a staff member is one row, not a new report.
Signed in as
Allowed
Segments they see
Ward 3 office
Ward 3 only
1,539
Ward 5 office
Ward 5 only
1,988
City engineer
All wards, plus county and state roads in the city's layer
11,655
Ward 3 office, querying the raw tables
Refused; ward staff can only read the report views
0
Counts are from the automated tests and a live run on November 9, 2026.
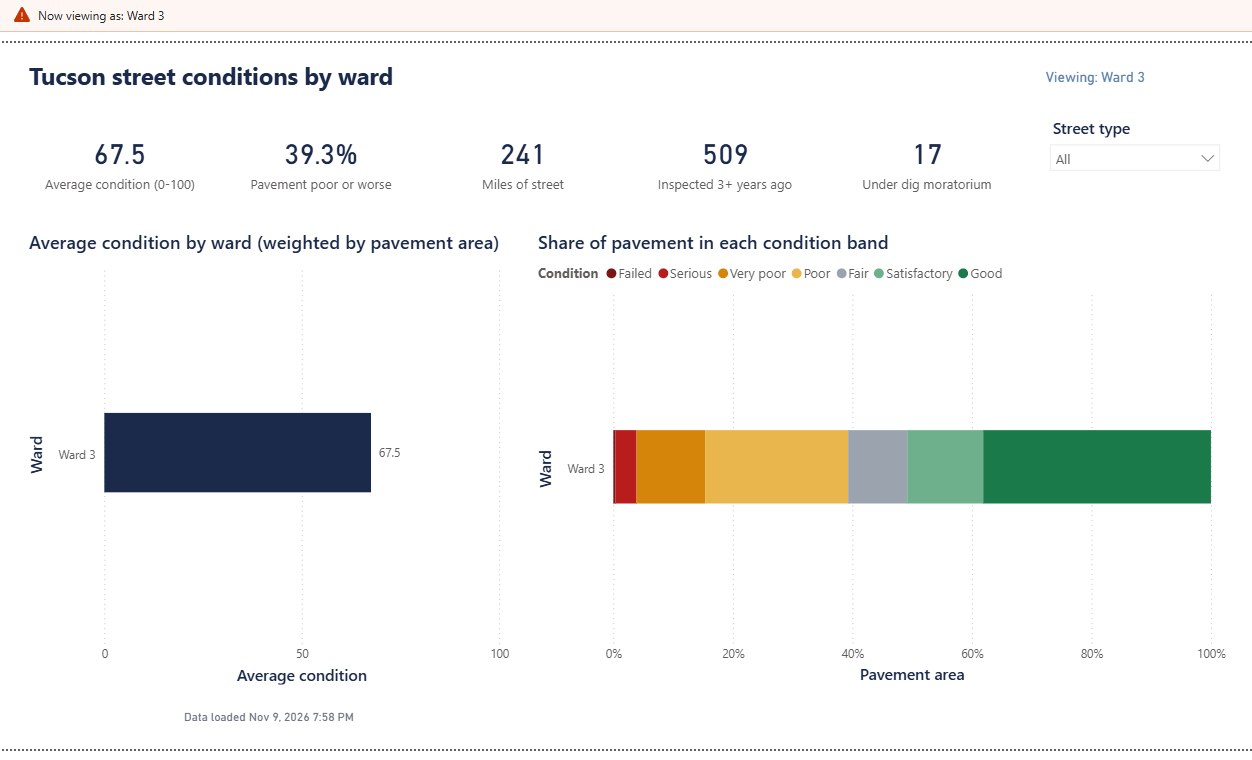
View as Ward 3. The same scorecard through the Ward 3 role: 67.5 average, 39.3% poor or worse, 241 miles, 17 under a moratorium. Every visual drops the other wards, and the numbers match the database's own Ward 3 summary.
Under the hood
Built to be run by someone else.
Rerun safely
Running it twice changes nothing
Each row carries a fingerprint of its values. A second load of the same data reports 11,655 unchanged and writes nothing.
Change history
Trend the city's layer can't show
The city keeps only today's score. Every time a score changes, the old and new values are saved, so trend builds up night by night.
Fails loudly
A bad night doesn't slip through
If a full download comes back 10% smaller than last time, the load stops before touching the real data. An impossible score fails the run too, and the log says why.
One log row per layer
Easy to answer "did it run?"
Start, finish, rows read, new, changed, unchanged, status and error message for every layer, every night.
Scheduled
Nightly and weekly
One script sets up Windows Task Scheduler: only the changes every night at 2:15, the whole layer every Sunday so streets the city removed get flagged.
Tested
16 automated tests
Unit tests for the PowerShell functions, and database tests that build a throwaway copy, load sample streets and check the merge, history, checks and security.
The analyst work
The documents a city project would need.
Requirements
Who needs what, what's in and out of scope, and every requirement traced to the test that proves it.
User stories
Epics and stories with acceptance criteria, in a file Jira imports directly.
Process maps
How a ward office gets street information today, and how it works with this system, in standard BPMN.
Test plan
Unit, integration, regression and security tests, plus the hands-on checks for the report and the map.
Runbook
What runs when, where the logs are, what each warning means and what to do about it.
Findings
What the data says, what each finding means for a decision, and what the data can't tell you.
Tools
Windows PowerShell 5.1, SQL Server 2022 Express and T-SQL, Power BI Desktop with DAX and row-level security, ArcGIS Online with Arcade, Pester for tests, BPMN for process maps, Jira for stories.
What it can't tell you
Costs. The data has pavement area but no repair prices, so no dollar figures here.
How fast streets get worse. That needs the score history this system has only started collecting.
How the city's staff work today. The current-process map is my assumption, to confirm with them.